Overview - adding a new post
Click Posts > Add New
- Enter Title in the title box
- Under Post Image, select a position for the main image. Click Add Image. To upload a new image, click the Upload Files tab and follow instructions. Or select an image from the Media Library
- Under Byline, select a User to be the author. Or enter a name / image to appear. If you want the image to be square (and not cropped to a circle), check the Square Image box.
- Select a Category and tags in the right hand column.
- Add text content under First Text Block
- If other types of content are required, click Add Content under Content
(see below for details) - Click Publish
Adding a Pull Quote
For best results, only add a pull quote directly before a Text block
- Click Add Content, and select Pull Quote
- Enter Text for the Quote, and the Citation (which appears at a smaller size)
Adding Text
- Click Add Content, and select Text
- Enter Text in the text area
Adding a video
- click Add Content, and select Video
- Paste the link to the video into the Video Link field
- Optionally, add an image to appear as a placeholder until the play button is pressed
Adding an Image / Slideshow
- Click Add Content, and select Slideshow
- Click Add Slide
- Add an image to the slide, and an optional caption. If no caption is entered here, the caption will be taken from the image’s own caption when it was uploaded
- Click Add Slide to add more slides as required.
Adding a data table
- Click Add Content, and select Table
- Select a number of columns
- Indicate whether the first row is a header. This will change its style to have a background colour.
- Click Add Row to make rows for the table, and fill the cells as they appear
Adding a Chart (Line or Column)
- Click Add Content, and select Chart (Line / Column)
- Select whether this is a Line or Column Chart.
- Under Unit Symbol select a unit for the figures as entered
-
Y axis title (Left) adds a title to the left of the left vertical axis
- Two Y axes will enable rows of data to align to a right vertical axis. A title can be added for this axis to appear to its right.
- Number of data points controls the amount of points/columns along the horizontal axis
- Add Labels for the data points
- Click Add Row to add data – Add a title for the row, an optional colour for the line / column(s) (otherwise a preselected palete will be used)
Each figure in a row will correspond to a data point on the horizontal axis as created in step 7
Adding a Pie Chart
- Click Add Content, and select Pie Chart
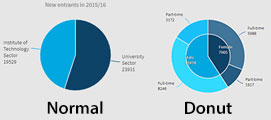
- “Normal” and “Donut” charts are illustrated below. A Donut chart can effectively have two charts shown at once, to show another level of data
- Chart Title is optional and will appear above the chart
- Chart Subtitle is optional and will appear below the chart
- Choose a unit for the figures
- Click Add Row to add Slices to the pie chart. Enter a title and figure and optional colour for each slice.
- Add Drilldown will enable a sub set of rows to be added.
On a Normal pie chart this will result in a clickable slice that reveals another pie chart.
On a Donut chart, the intital set of rows will populate the inner pie chart, and the drilldowns appear as outer layer.
Adding a Call to Action
- Click Add Content, and select Call to Action
- Link Text will populate the text in the link
- Choose Link Type. This will reveal the relevant input
- External / Full Link – Enter a full link to a webpage
- Internal Link – Select a page from the current site
- File Download – Upload a new file, or select from Media Library